Population: 64, 088, 222
Density: 267 sq. km
Net Migration Rate: 2.54 migrant(s) / 1,000 population
Birth Rate: 12.17 births / 1,000 population
Death Rate: 9.35 deaths / 1,000 population
Rate of Natural Increase: 3.01 per 1,000 population
Population Growth Rate: .54%
Infant Mortality Rate: 4.38 deaths / 1,000 births
Total Growth Rate: 1.89 children born / woman
Population Age <15 %: 64.9%
Population Ages 65+ %: 17.73%
Dependency Rate: 82.63
Life Expectancy at Birth: 80.54 years
Life Expectancy at Birth Females: 82.83 years
Life Expectancy at Birth Males: 78.37 years
Primary School Completion Rate Females: N/A
Primary School Completion Rate Males: N/A
Secondary School Enrollment Net Females: 132
Secondary School Enrollment Net Males: 98
GNI PPP per capita in US$: 42,690
Economically Active Females 15+: 55
Economically Active Males 15+: 70
Mobile Phone Subscribers: 21,500
Motor Vehicles: 31.5 million
Undernourished Population: 5%
Underweight Children Under Age 5: N/A
HIV/AIDS Among People Ages 15-49: .3%
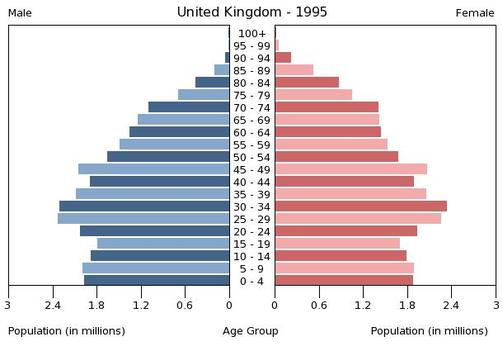
Population Pyramid:
1995:
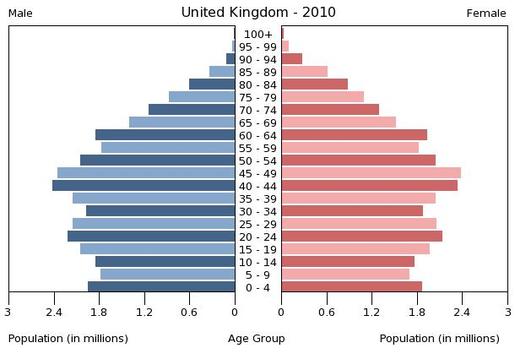
2010:
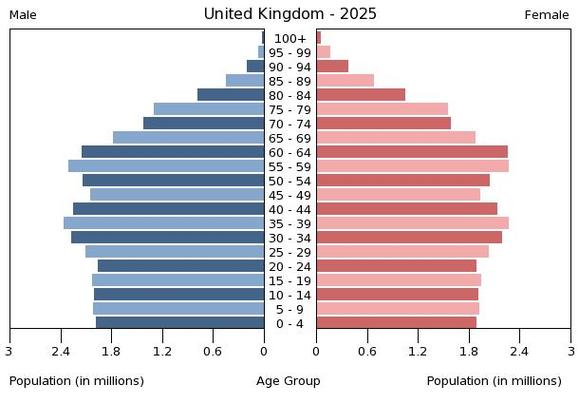
2025:
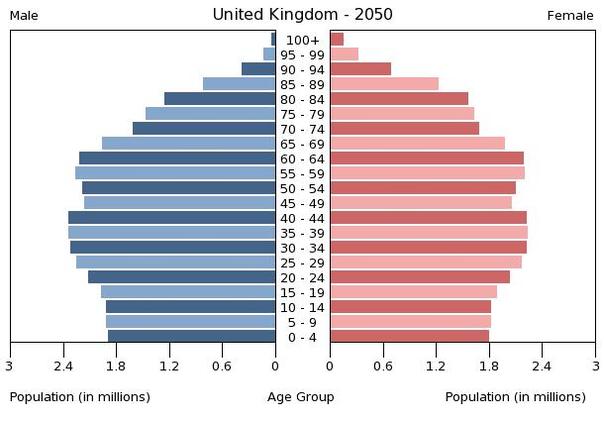
2050:
Demographic Transition Model:
From the information above, I believe the United Kingdom is in stage four of the demographic transition model. The birth rate for the UK is low. It is 12.17 / 1,000 population which is low and is steady like the death rate. The death rate is 9.35 / 1,000 and according to the chart for stage four, it states the death rate is low which leads to life expectancy. Since the death rate is low, the life expectancy is 65 to 75. Another concept is the rate of natural increase. 3.01 per population is the rate of natural increase in the UK and that is what it should be for the country to be in stage four. Also since the population growth is stable, it won't transition into stage five and the pyramid will flip.
